

A dashboard that waits until month-end to surface operating issues is too slow for day-to-day decisions. A spa business KPI dashboard should be reviewed daily, weekly, and monthly, with a distinct purpose at each cadence: scan a daily brief for 60 seconds each morning, review a condensed scorecard for 15 minutes every Monday morning, and set aside 15-20 minutes at the end of each month for a broader review. Use four-week rolling averages before changing course in response to a slow week.
That rhythm keeps reviews focused without making reporting another operational burden. The challenge is not simply collecting metrics, but identifying which changes need attention now, which are short-term fluctuations, and which point to recurring performance issues. This guide outlines the core measures to monitor across bookings, revenue, operations, and client retention, with a practical review frequency for each.
It also shows how to organize a dashboard around business health and guest satisfaction, connecting service demand, available capacity, financial performance, and returning clients. The result is a clearer routine for turning measurement into action across a spa or multi-location operation.
Key Takeaways
- Measure booking conversion and treatment utilization together to spot where demand is strong and provider capacity is underused.
- Compare revenue per clinical hour with client acquisition cost and lifetime value to assess whether growth is creating sustainable returns.
- Build a focused scorecard around financial performance, operating capacity, and client retention rather than tracking metrics without a clear decision attached.
- Use retention, average ticket value, and no-show rate as practical starting measures, then add KPIs that reflect your spa’s priorities.
- Bring financial performance and guest satisfaction into one dashboard view to connect service outcomes with business health.
Booking conversion and treatment utilization
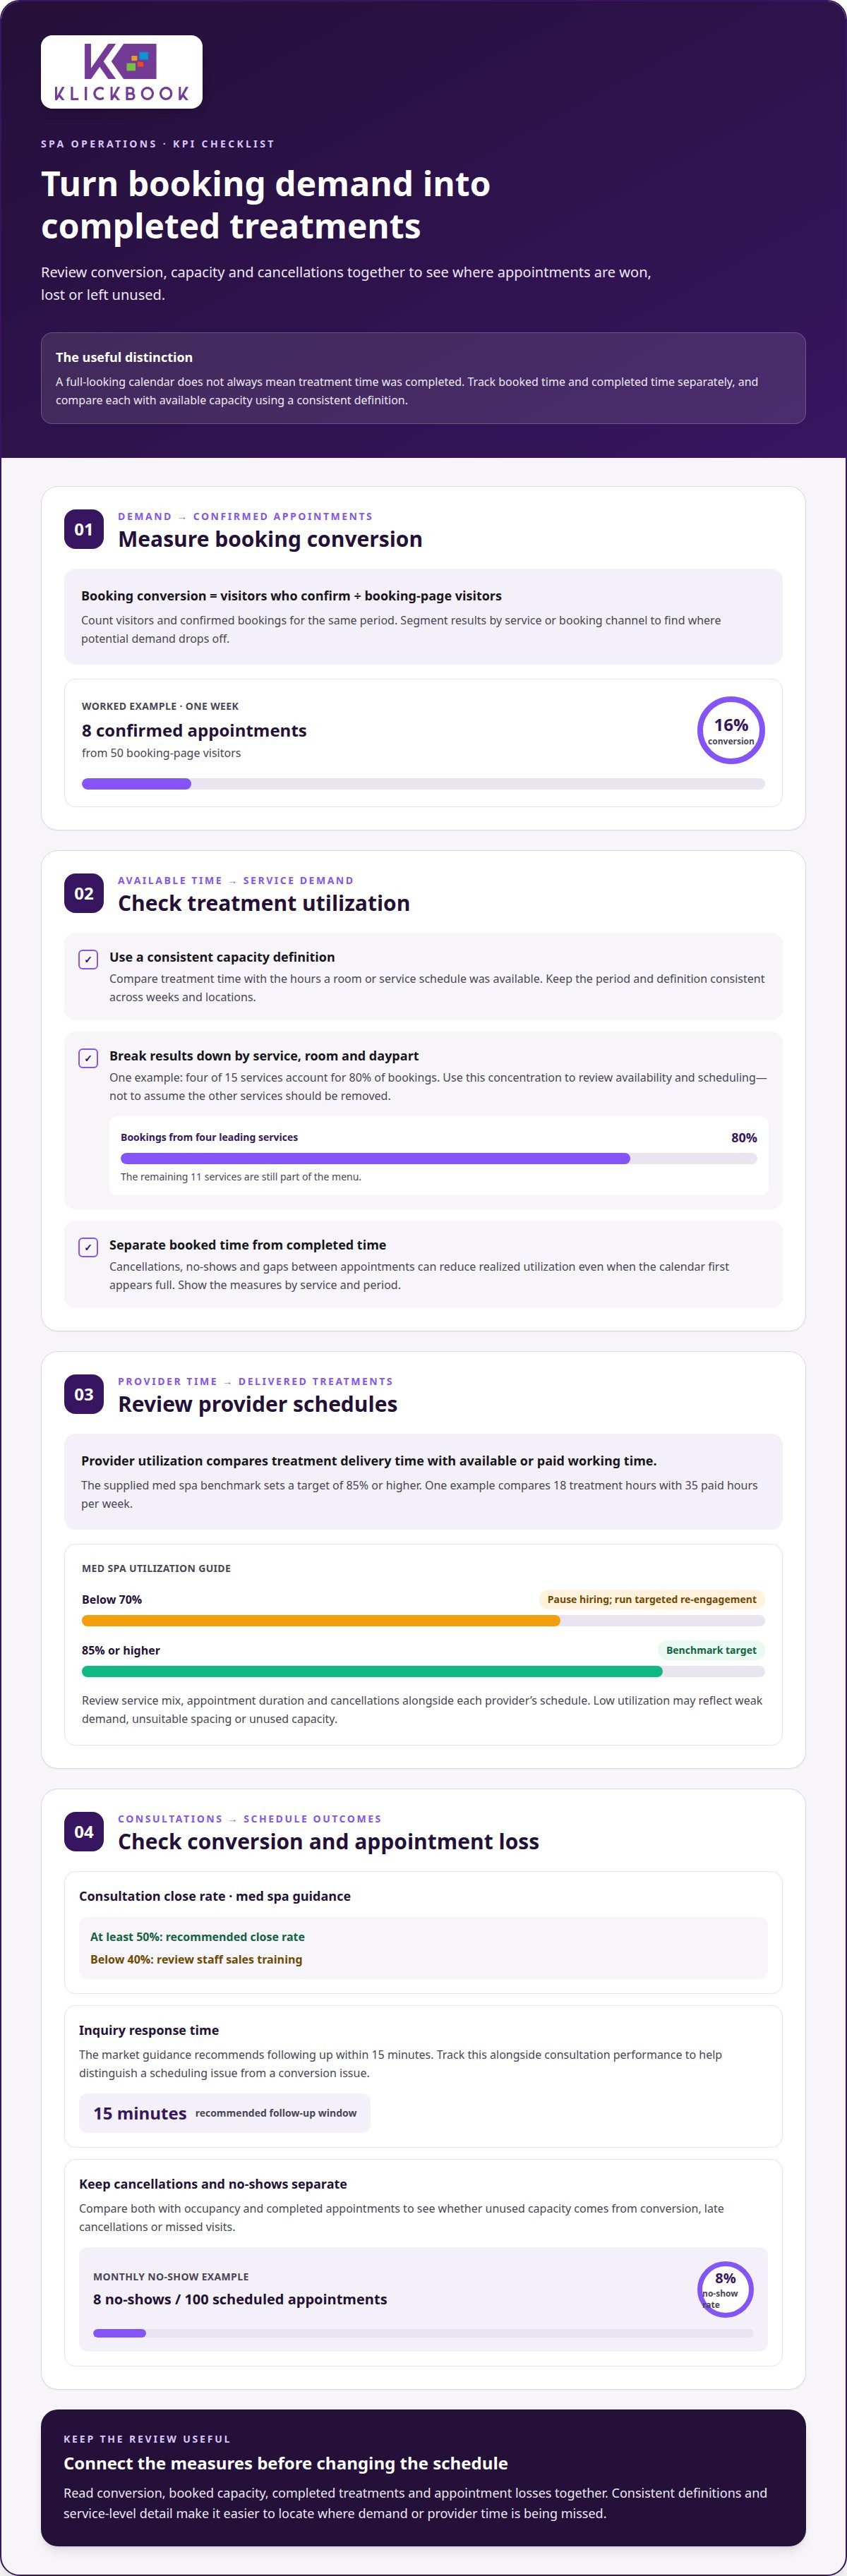
Track booking conversion, treatment capacity, and provider utilization separately. Together, these measures show whether demand is turning into appointments and whether schedules are using available capacity effectively.
Treatment Utilization
Treatment utilization compares booked treatment time with the treatment capacity available during a defined period. For example, compare completed appointment hours with the hours a treatment room or service schedule was available. Keep the period and capacity definition consistent, or comparisons across weeks and locations may mislead.
Break the measure down by service, room, and daypart. A service-level view can show whether demand concentrates on a small part of the menu; one example has 80% of bookings coming from four of 15 services. That leaves 11 services outside the four leading services. Use this pattern to review availability and scheduling, not to assume lower-booked services should be removed.
Distinguish booked time from completed treatment time. Cancellations, no-shows, and gaps between appointments can lower realized utilization, even when the calendar initially looks full. A spa business KPI dashboard should show these differences by service and period.
Provider Scheduling and Performance
Provider utilization compares time spent delivering treatments with the provider’s available or paid working time. A med spa benchmark in the supplied market data sets the target at 85% or higher. One example compares 18 treatment hours with 35 paid hours per week, revealing substantial capacity outside patient-facing appointments.
Review each provider’s schedule alongside service mix, appointment duration, and cancellations. A low result can reflect weak demand, unsuitable appointment spacing, or scheduling that leaves capacity unused. For med spas below 70% provider utilization, the stated response is to pause hiring and run a targeted re-engagement campaign.
Pair utilization with consultation performance before making staffing decisions. The recommended med spa consultation close rate is at least 50%; below 40%, review staff sales training. Track inquiry response time too: the market guidance recommends following up within 15 minutes. These measures help distinguish a scheduling problem from a conversion problem.
Booking and Cancellation Rates
Booking conversion is the share of booking-page visitors who confirm an appointment during the measured period. Canadian occupancy, booking-conversion, and cancellation rates vary by service mix, operating hours, location, and calculation method. Use consistent historical comparisons rather than assuming a single national benchmark.
For a worked conversion example, eight confirmed appointments from 50 booking-page visitors equal 16% for that week. Record visitor and confirmed-booking counts together, then segment by service or booking channel. This helps locate where potential demand drops before an appointment is secured.
Cancellation and no-show rates measure scheduled appointments that do not proceed as planned. In one monthly example, eight no-shows among 100 scheduled appointments produce an 8% no-show rate. Track cancellations separately from no-shows, then compare both with occupancy and completed appointments. That deeper view shows whether open capacity comes from booking conversion, late cancellations, or missed visits.
Revenue per treatment, client acquisition cost, and client lifetime value
Track revenue yield alongside acquisition and retention economics to see whether growth is generating sustainable contribution. A useful review connects treatment-level revenue, guest spending, payroll, and cash obligations instead of treating each figure in isolation.
Revenue per Treatment and Available Hour
Revenue per treatment is treatment revenue divided by completed treatments; average ticket is total guest spending divided by transactions. Revenue per available treatment hour is treatment revenue divided by the hours offered for booking. These definitions distinguish service yield from broader guest spending.
For example, C$3,200 in revenue across a 40-hour week equals C$80 per available hour. For a med spa, the market benchmark is C$300 to C$600 or more per clinical hour; below C$250, review pricing or provider cross-selling. Segment results by service and provider to locate the source of a gap.
Revenue-per-treatment metrics also need a cost view. If one provider uses 60 units where a standard treatment uses 50, that provider’s treatments have 20 percent higher cost of goods sold. Compare treatment revenue with actual product use before interpreting a higher average ticket as stronger performance.
Client Acquisition Cost and Lifetime Value
Client acquisition cost (CAC) is marketing and sales spending divided by the number of new clients acquired; lifetime value (LTV) is the revenue attributed to a client over the relationship. Compare both for the same acquisition cohort and measurement window to avoid mixing unlike groups.
A med spa example pairs C$400 in acquisition cost with C$600 in client lifetime revenue, producing an LTV-to-CAC ratio of 1.5:1. The recommended target is 3:1 or higher; below 2:1, optimize marketing spend and prioritize services linked to stronger retention. Revenue alone is not profit, so interpret the ratio alongside service delivery costs.
Guest-spend metrics show how service visits translate into broader revenue. Measure average ticket, retail attachment, and revenue by service category; for example, 12 retail purchases across 80 service appointments equal a 15% attachment rate for that month. A point-of-sale record can help separate treatment revenue from retail transactions and clarify changes in guest spending.
Payroll as a percentage of revenue is payroll expense divided by revenue, multiplied by 100. Review it beside provider hours and revenue per compensated hour: rising payroll share with flat revenue can signal a mismatch between scheduled labour and realized demand. Compare equivalent periods and locations before adjusting staffing.
Deferred revenue coverage compares remaining prepaid obligations, such as packages or memberships, with the service capacity and cash available to fulfil them. Track outstanding balances alongside redemptions and future bookings: prepaid sales bring cash forward, while unredeemed services remain an operating commitment. A spa business KPI dashboard can bring these figures together, making revenue and delivery obligations easier to assess.
How Often Should You Review Your Data?
Set a review cadence that separates daily exceptions from weekly trends and monthly decisions. Consistent tracking makes each KPI easier to interpret against its benchmark and operating context.
Daily, Weekly, and Monthly Reviews
A review cadence assigns specific decisions to daily, weekly, and monthly dashboard checks. Use a 60-second morning scan to flag booking changes, cancellations, and unusual sales activity. Reserve 15 minutes every Monday morning for a condensed scorecard. At month-end, set aside 15-20 minutes to examine broader patterns and agree on actions.
To build a dashboard from booking, point-of-sale, and accounting data, map shared fields such as transaction date, service category, and location. Reconcile totals across systems before comparing revenue or margins, and automate data transfers where available.
Use four-week rolling averages before changing a process in response to a single slow week. A weekly dip in retail sales, for example, may reflect timing rather than sustained demand. Compare the current result with the metric’s recent pattern, then assign an owner and review date to each action.
In Canada, privacy and health-information obligations depend on the province and the type of customer data collected. For KPI reporting, minimize identifiable information, limit access by role, and use aggregated results when individual records are unnecessary.
Monthly Data Review Checklist
A monthly data review checklist provides a repeatable way to validate results, identify changes, and assign follow-up. Start by reconciling booking, point-of-sale, and accounting totals. Then compare revenue, payroll percentage, treatment utilization, client retention, and cancellations with the prior period and established benchmarks.
Next, review guest reviews and retail performance together. A 3.5-star average rating in an example dashboard gives a prompt to inspect review themes, not a standalone diagnosis. If retail sales fall 25% year over year, compare product categories, transactions, and service visits to isolate the change.
Keep benchmark definitions stable by noting the period, numerator, denominator, and any exclusions for every percentage. This prevents a changed calculation from appearing to be a performance shift. Record each finding as a decision, an assigned owner, or a follow-up item.
Close the monthly review by checking data completeness and recording unresolved discrepancies. A 29% share of webinar-poll respondents said they didn’t measure metrics regularly, highlighting the need for a scheduled review routine. Collect comments from managers before finalizing changes; this adds operating context to software-generated reports without replacing the underlying figures.
Finally, check in later reviews whether actions affect guest experience and operating margins. A KPI-driven process links each adjustment to a measure, a review date, and an accountable owner. Keep the scorecard concise enough for a Monday review, with supporting detail available for monthly analysis.
Financial, operational, and client-retention KPIs
A balanced scorecard connects financial results, service operations, and client experience. Most med spas track 8-12 KPIs across these categories, then compare results with the same definitions and periods.
Client Retention and Rebooking
Client retention rate measures the share of unique clients who return during a defined period; rebooking rate measures the share who schedule another visit. In one example, 52 returning clients among 80 unique clients equal 65% retention over the past 90 days.
A reasonable med spa retention target is above 75%, while the recommended patient rebooking rate is at least 60%. If rebooking falls below 50%, audit checkout and rebooking processes. Compare results by service and client cohort, since an overall rate can conceal different return patterns.
Client Satisfaction Score
Customer satisfaction score (CSAT) records how clients rate a service or experience using a defined survey question. A strong healthcare satisfaction score typically falls in the 60s to 80s. Review the score alongside response volume and recurring feedback themes, rather than treating one rating as a complete account of client experience.
For example, compare satisfaction across service categories or stages of the visit. A lower result around booking or checkout points to a different operational issue than feedback about the treatment itself. Consistent question wording makes month-to-month comparisons more useful.
Net Promoter Score
Net Promoter Score (NPS) measures clients’ willingness to recommend a business, using responses on a 0-to-10 scale. Promoters score 9-10, passives score 7-8, and detractors score 0-6. Calculate NPS by subtracting the percentage of detractors from the percentage of promoters.
The average healthcare NPS is around +58. Compare a spa’s score across periods and locations, then examine comments alongside the number. A score shift can direct attention to service consistency, scheduling, or follow-up; it doesn’t identify the cause by itself.
Financial KPIs measure how revenue converts into operating performance; operational KPIs show how resources and service delivery affect that result. For a med spa, consumables should not exceed 25% to 30% of treatment revenue. Track the percentage by service category, then investigate increases through product use and treatment mix.
Keep the scorecard actionable: start with client retention, average ticket value, and no-show rate, then add measures tied to the spa’s operating priorities. A C$10 increase in average ticket value is one example of a small monthly optimization that can accumulate over a year. Cross-industry research summarized by Harvard Business Review states that acquiring a customer costs five to 25 times as much as keeping one, reinforcing the value of tracking retention beside acquisition.
Business health and guest satisfaction dashboards
A business health dashboard brings financial, operational, and guest-experience measures into one decision view. For med spas, a practical dashboard can track 10 to 12 actionable KPIs, but each measure needs a clear owner and business purpose.
Start with three to five measures aligned with current objectives, then expand as reporting routines mature. A spa focused on profitability might pair revenue mix with labour and consumables; one focused on guest experience might add satisfaction and rebooking indicators. Choose measures to guide operating decisions, not simply because the data is available.
Use a one-page layout for executive review, with detailed reports available for investigation. The Massage Therapy and Spa Services Executive Dashboard Template is designed as a one-page performance dashboard. Place headline results beside their benchmarks and trends, and separate current performance from explanations, exceptions, and assigned actions.
Guest satisfaction belongs beside business results because experience signals can inform operational review. In a dashboard example, an average guest rating of 3.5 stars prompts a closer look at feedback themes and service stages. Keep the rating connected to its collection period and response context, so leaders can interpret the number rather than treat it as a complete diagnosis.
Data quality is part of dashboard governance. Fifty-one per cent of organizations without properly automated performance measurement systems experienced negative impacts on data accuracy, reporting efficiency, and trust in data-driven decisions. Define each KPI’s source, calculation, reporting period, and responsible owner. Consistent definitions let managers compare locations and monthly results without confusing calculation changes with real performance shifts.
Build reports around a small set of decision categories:
- Financial health: monitor revenue mix, operating costs, and profitability indicators.
- Operational performance: compare capacity, service delivery, and resource use.
- Guest experience: review satisfaction results alongside recurring feedback themes.
- Management action: record the accountable owner and next review point for each material variance.
Use benchmarks as reference points, not automatic targets. Compare a property with its own prior performance and relevant internal locations, then investigate the cause of a material variance. Monthly reports can reveal persistent changes that a single-period average obscures. Retain supporting detail so operational teams can trace results to the underlying activity.
Point-of-sale records can contribute to a revenue view that distinguishes guest purchases from other operating measures. Explore point-of-sale capabilities as part of a dashboard architecture that connects guest transactions with business performance.
Milano Software: Spa Management
Milano Software provides spa management software with online booking, reporting, and point-of-sale capabilities. These tools support a consistent KPI review by bringing booking activity, guest transactions, and operational reporting into the management workflow.
Online booking lets spa clients schedule appointments and service packages 24/7 from any device. Point-of-sale capabilities support transaction tracking, while reporting tools provide a basis for reviewing performance measures. Together, these offerings help operators examine booking activity, sales, and business results within their spa operations.
For day spas, resort spas, and Nordic spas refining their measurement approach, Milano Software offers spa management tools that support operational workflows and performance reporting. Visit milanosoftware.com to learn more about Milano Software’s spa management solutions.
Turn KPI visibility into operating discipline
The next step is to connect each metric to a decision owner and a defined response. A spa business KPI dashboard is more useful when leaders know who investigates a variance, which operating decision follows, and how the result will be assessed. This turns reporting into a management tool rather than a passive record.
Set accountability before expanding the scorecard. Start with the decisions that matter most to your operation, assign responsibility, and refine the dashboard as teams use it. Clear ownership keeps performance discussions focused on causes and actions, rather than competing interpretations of the same numbers.
For operators assessing how spa management systems can support this work, Milano Software provides spa management, online booking, and reporting capabilities. Aligning operating workflows with performance visibility can help create a consistent foundation for decision-making.
Contact Milano Software to discuss your needs and identify a practical next step for your spa’s operating priorities.
Frequently Asked Questions
What Are the Most Common Dashboard Mistakes to Avoid?
Avoid counting the same transaction in multiple revenue categories or treating package sales as completed service revenue. A prepaid package sale and its later redemption, for example, are distinct events, not two completed treatments. Check refunds, transferred bookings, and cancelled appointments before interpreting a report. Document how each event is classified so managers can compare activity without confusing accounting timing with service demand.
What KPIs should a spa business dashboard include?
Include measures of demand, capacity, financial outcomes, workforce performance, and guest experience. Add useful breakdowns by service line, booking channel, provider, and location to identify where a result originates. Include data-quality indicators, such as missing service categories or unmatched transactions. These checks help distinguish an operating change from a reporting defect before managers assign corrective actions.
What are spa customer retention, rebooking, and repeat-visit benchmarks?
Use internal client cohorts to establish relevant retention and repeat-visit benchmarks, as visit patterns vary by service and spa model. Group clients by first-visit period and service category, then observe whether they return within an interval suited to that offering. Exclude test records and duplicate profiles. Like-for-like cohort comparisons provide a more meaningful baseline than one universal target for day, resort, and thermal spas.
How should a spa track therapist utilization, labour costs, and service productivity?
Use consistent schedule records that distinguish treatment time from training, meetings, breaks, and other assigned duties. Then compare provider output with the time actually available for appointments. For labour analysis, classify wages, commissions, and related payroll costs consistently across teams. Review service productivity alongside appointment duration and room availability: a provider’s output may be constrained by room access or service mix, not just schedule design.
Which retail sales KPIs should a spa dashboard track?
Track product sell-through, inventory turnover, stockout frequency, return rate, and gross margin by category. These measures add context to sales totals: frequent stockouts may suppress sales, while slow-moving inventory can tie up working capital. Compare retail activity across locations and service categories to identify relevant product patterns. Keep discounts and returns visible so reported performance reflects the transactions guests actually retain.
How should spas measure customer satisfaction, reviews, and complaints?
Combine post-visit feedback with public-review monitoring and a structured complaint register. Tag each issue by visit stage, service category, and resolution status, then distinguish recurring operational problems from isolated comments. Track review sources separately because platforms may attract different guest segments. Managers can identify themes, assign follow-up, and assess whether corrective actions address the underlying issue, not just an individual complaint.
What software and pricing options are available for spa KPI dashboards in Canada?
Options include spreadsheets, business-intelligence tools, and spa management platforms with reporting functions. Pricing models may use per-location subscriptions, user-based tiers, or separately licensed analytics tools. Compare included data connections, reporting access, implementation requirements, and support. Request costs in Canadian dollars and assess the overall operational fit, not just the subscription amount. Spreadsheets may suit manual reporting, while integrated systems can reduce separate data handling.
How often should spa managers review KPIs, and how should they set targets?
Set targets from a documented baseline and record the assumptions behind each one, including service mix, operating capacity, and planned changes. Separate leading indicators, such as inquiry volume, from lagging outcomes, such as completed service revenue. When targets change, preserve the previous definition and effective period for comparison. This creates a traceable performance history and prevents revised calculations from making results appear stronger than the underlying operation.


